Fed Drama and Trade Tensions Slam S&P 500
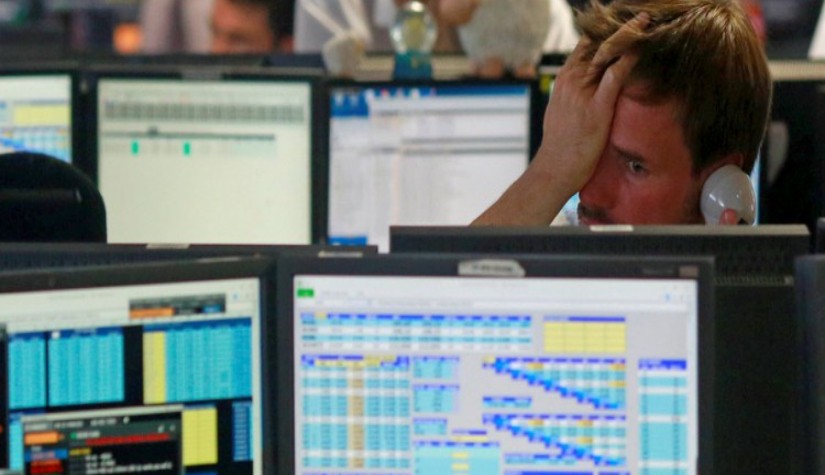
U.S. markets suffered sharp losses as political and economic tensions rattled investor confidence. President Donald Trump escalated his attacks on Federal Reserve Chair Jerome Powell and demanding immediate interest rate cuts to avert an economic downturn. The criticism, echoed by White House economic adviser Kevin Hassett—who even floated the idea of removing Powell—has amplified concerns over the Fed’s independence, a pillar of monetary policy stability.
Markets reacted swiftly to the heightened political pressure. The S&P 500 fell 2.36%, the Dow dropped 2.48%, and the tech-heavy Nasdaq slid 2.55%. Volatility surged, with the VIX spiking nearly 14%, while the dollar index plunged to its lowest level in three years. All 11 S&P 500 sectors ended in the red, with technology and consumer discretionary leading the losses.
The fallout was particularly severe among the “Magnificent Seven” tech stocks. Tesla and Nvidia posted steep declines amid concerns over weakening demand and mounting earnings pressure. Tesla faces multiple headwinds, including production setbacks and CEO Elon Musk’s polarizing political profile. Alphabet also came under pressure ahead of its earnings report, with investors wary of mounting regulatory scrutiny and uncertain returns from its AI investments.
Meanwhile, Netflix stood out as a rare bright spot. The streaming giant reported minimal impact from tariffs on consumer behavior, though analysts warned that rising inflation could dampen broader spending trends over time.
Looking ahead, investors are closely watching this week’s corporate earnings, with Tesla and Alphabet set to report first among the major tech players. Other high-profile names on the calendar include Intel, Merck, IBM, Boeing, and Procter & Gamble—each offering clues about how companies are weathering policy headwinds and global uncertainty.
Geopolitical risks added fuel to the market downturn. The U.S.-China trade war reignited after Trump imposed tariffs of up to 145% on Chinese imports, prompting Beijing to retaliate with 125% duties. China also cautioned other countries against entering trade deals that undermine its interests, escalating the tension further.
Against this volatile backdrop, a dense economic calendar could provide additional clarity—or deepen uncertainty. On Tuesday, markets will scrutinize the IMF’s global economic outlook, a focal point of the IMF and World Bank Spring Meetings in Washington. IMF Managing Director Kristalina Georgieva has warned that escalating tariffs pose a “significant risk” to global growth and has urged world leaders to reduce trade tensions.
On Wednesday, attention will turn to the flash U.S. Purchasing Managers’ Index (PMI), among the first tangible data points since Trump’s latest trade maneuverings. Analysts expect the tariffs to stoke inflation and impede growth, with many firms already reporting strategic uncertainty. The same day, the Federal Reserve’s Beige Book will offer a snapshot of current economic conditions ahead of the Fed’s next policy meeting. In March, the Fed held rates steady at 4.25%–4.50%, while signaling a more cautious stance in light of trade risks.
Rounding out the week, the University of Michigan’s final consumer sentiment report is due Friday. The preliminary reading showed sentiment had deteriorated sharply in April, with inflation expectations reaching their highest levels since 1981.
The S&P 500 has broken below near-term support at 5,200, increasing the likelihood of a correction toward the 5,100–5,050 zone. If bearish momentum continues, a deeper pullback to the 4,950–5,000 range is possible. However, upcoming corporate earnings, along with macroeconomic data, could trigger a technical bounce if results are strong and inflation concerns ease. A rebound above 5,220 would signal a potential recovery toward 5,280. Until there is greater clarity, volatility is expected to remain high, with investor sentiment fragile and reactive to policy headlines.
Data for Technical Analysis (1H) CFD US 500 [S&P 500]
Resistance : : 5192.9, 5197.7, 5205.3
Support : 5177.7, 5172.9, 5165.3
1H Outlook
 Source: TradingView
Buy/Long 1 If the support at the price range 5162.7 - 5177.7 is touched, but the support at 5177.7 cannot be broken, the TP may be set around 5195.2 and the SL around 5155.2, or up to the risk appetite.
Buy/Long 2 If the resistance can be broken at the price range of 5162.7 - 5177.7, TP may be set around 5210.0 and SL around 5170.2, or up to the risk appetite.
Sell/Short 1 If the resistance at the price range 5192.9 - 5207.9 is touched, but the resistance at 5192.9 cannot be broken, the TP may be set around 5175.2 and the SL around 5215.4, or up to the risk appetite.
Sell/Short 2 If the support can be broken at the price range of 5162.7 - 5177.7, TP may be set around 5155.0 and SL around 5200.4, or up to the risk appetite.
Pivot Points Apr 22, 2025 02:09AM GMT
| Classic |
5155.2 |
5165.3 |
5175.2 |
5185.3 |
5195.2 |
5205.3 |
5215.2 |
| Fibonacci |
5165.3 |
5172.9 |
5177.7 |
5185.3 |
5192.9 |
5197.7 |
5205.3 |
| Camarilla |
5179.6 |
5181.4 |
5183.3 |
5185.3 |
5186.9 |
5188.8 |
5190.6 |
| Woodie's |
5155 |
5165.2 |
5175 |
5185.2 |
5195 |
5205.2 |
5215 |
| DeMark's |
- |
- |
5180.3 |
5187.8 |
5200.3 |
- |
- |
Sources: Investing 1, Investing 2
______________________________
Maximize your knowledge:
ClickKeep up to date with global events and advanced analysis techniques:
Click